Diabetes Prediction Model
Project is in Progress
Preliminary Code
Graphical Outputs provided
Clean up Code and Further Model Building and Prediction
import pandas as pd
import matplotlib.pyplot as plt
import seaborn as sns
# Replace 'path/to/diabetes_data.csv' with the actual path to your CSV file
df = pd.read_csv('/Users/mohan/Desktop/Diabetes Prediction/diabetes.csv')
# Display the first few rows of the DataFrame
print(df.head())
# Summary statistics of the DataFrame
print(df.describe())
# Check for missing values
print(df.isnull().sum())
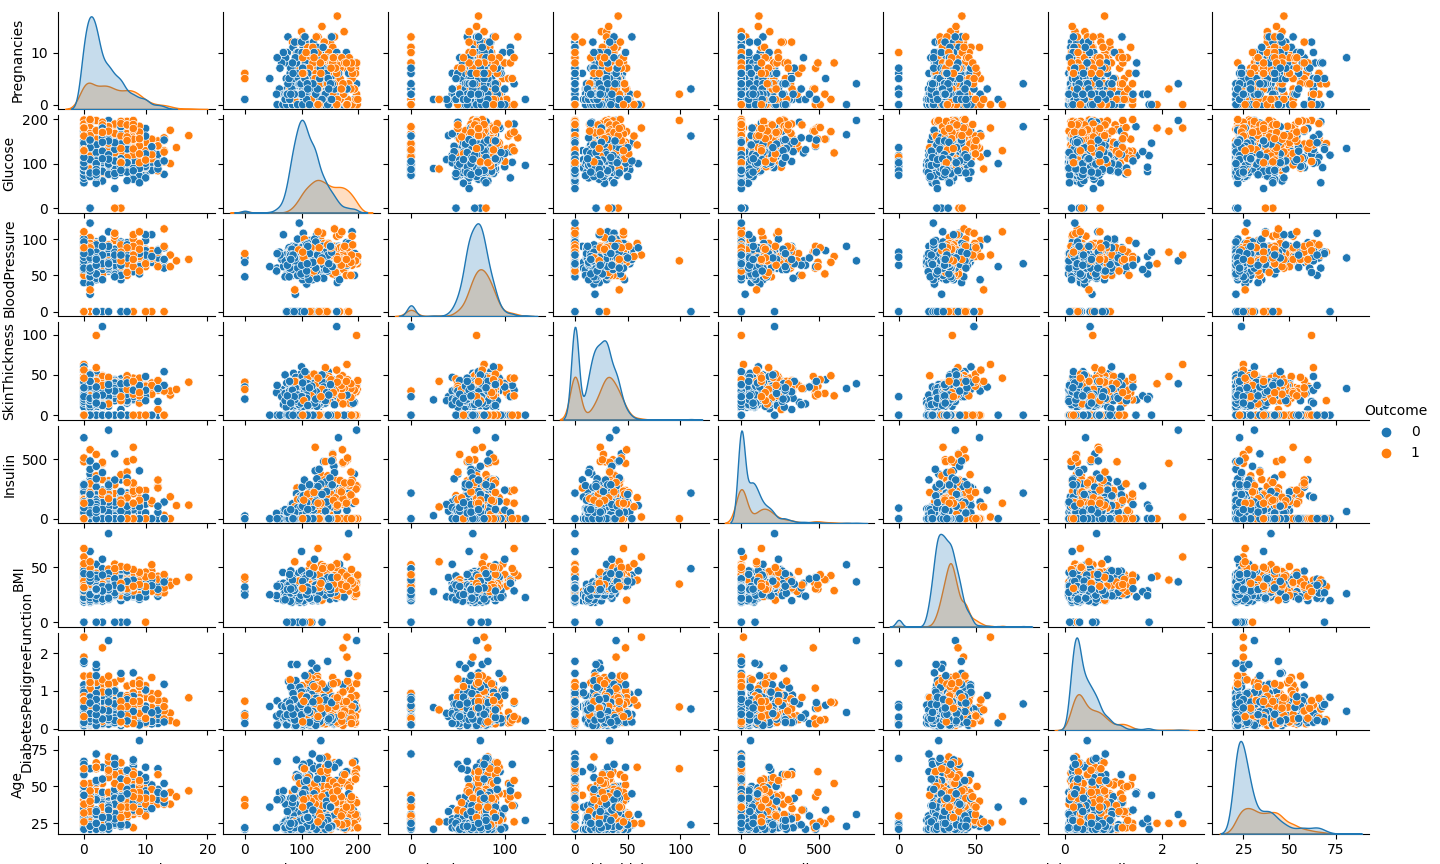
# Pairplot to visualize the relationships between variables
sns.pairplot(df, hue='Outcome')
plt.show()
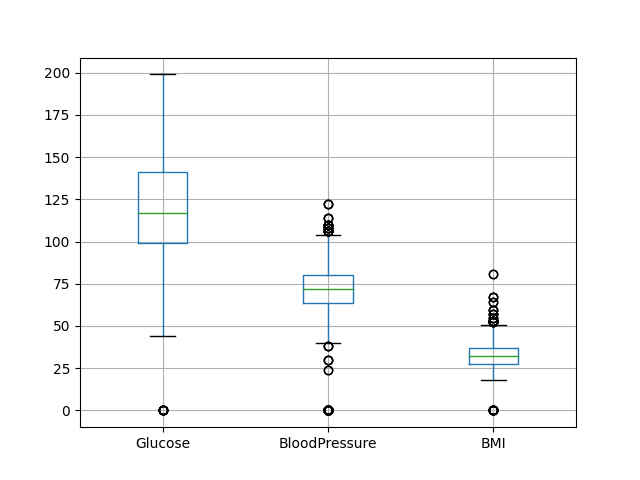
# Boxplot to visualize the distribution of numeric variables
df.boxplot(column=['Glucose', 'BloodPressure', 'BMI'])
plt.show()
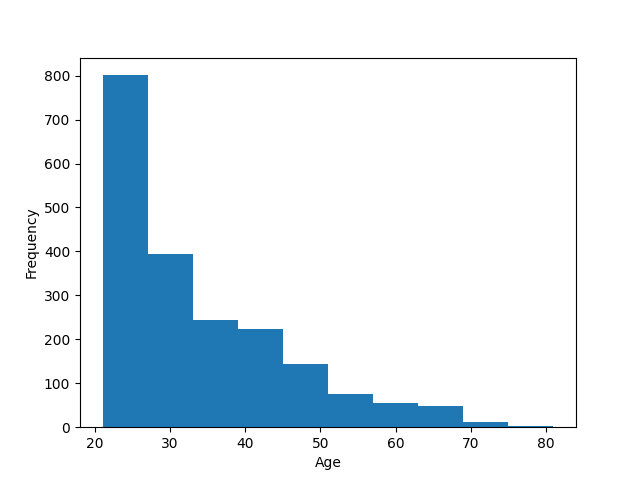
# Histogram to visualize the distribution of Age
plt.hist(df['Age'], bins=10)
plt.xlabel('Age')
plt.ylabel('Frequency')
plt.show()
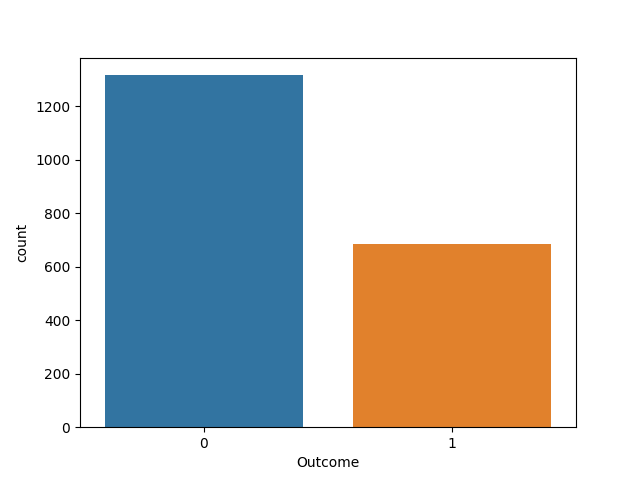
# Countplot to visualize the count of Outcome classes
sns.countplot(data=df, x='Outcome')
plt.show()
# Correlation matrix
correlation_matrix = df.corr()
print(correlation_matrix)
# Grouping data by Outcome and calculating means
grouped_df = df.groupby('Outcome').mean()
print(grouped_df)
Pregnancies Glucose ... Age Outcome Pregnancies 1.000000 0.120405 ... 0.539457 0.224437 Glucose 0.120405 1.000000 ... 0.254496 0.458421 BloodPressure 0.149672 0.138044 ... 0.238375 0.075958 SkinThickness -0.063375 0.062368 ... -0.111034 0.076040 Insulin -0.076600 0.320371 ... -0.085879 0.120924 BMI 0.019475 0.226864 ... 0.038987 0.276726 DiabetesPedigreeFunction -0.025453 0.123243 ... 0.026569 0.155459 Age 0.539457 0.254496 ... 1.000000 0.236509 Outcome 0.224437 0.458421 ... 0.236509 1.000000
[9 rows x 9 columns] Pregnancies Glucose BloodPressure ... BMI DiabetesPedigreeFunction Age Outcome ...
0 3.168693 110.586626 68.094985 ... 30.567477 0.434676 31.081307 1 4.732456 141.568713 71.166667 ... 35.320468 0.540681 36.956140